Viewing Your Data
With the Data Window, accessing your meteorological data is a breeze. This page details all the features inside this window, as well as how to visualize and export your data.
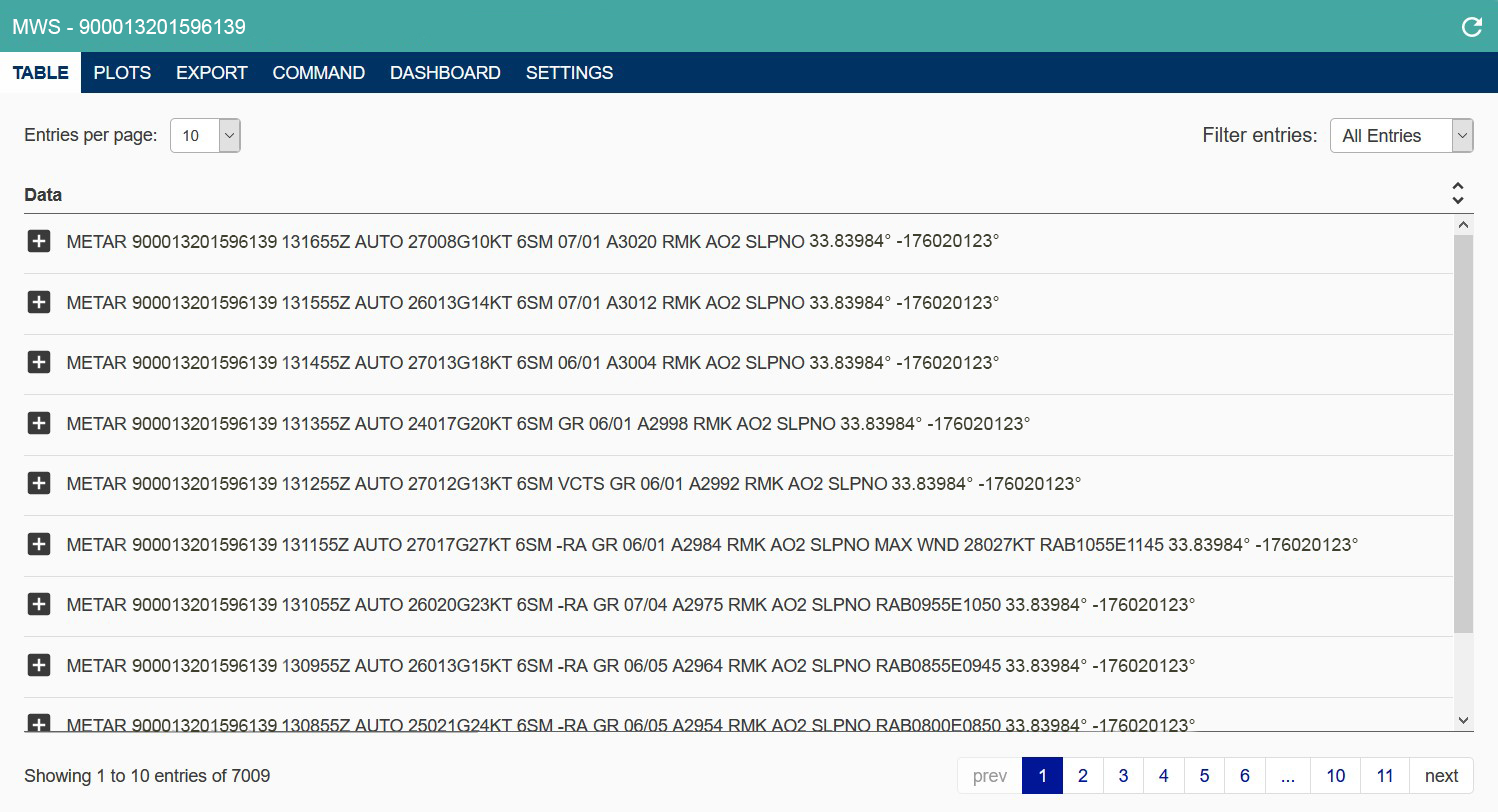
To access the Data Window, simply click on the IMEI/Alias number in the devices panel, and the Data Window will appear. The Data Window includes five tabs that enable you to visualize, plot, export, and command your environmental sensors.
The default view is the Table Tab, which shows historical sensor. It provides a list of the 10 most recent meteorological and system reports that can be expanded to show detailed weather and sensor status information. You can change the number of reports on this page using the drop-down menu at the top of the Data Window.
Clicking the plus symbol expands the METAR to show detailed weather and sensor status
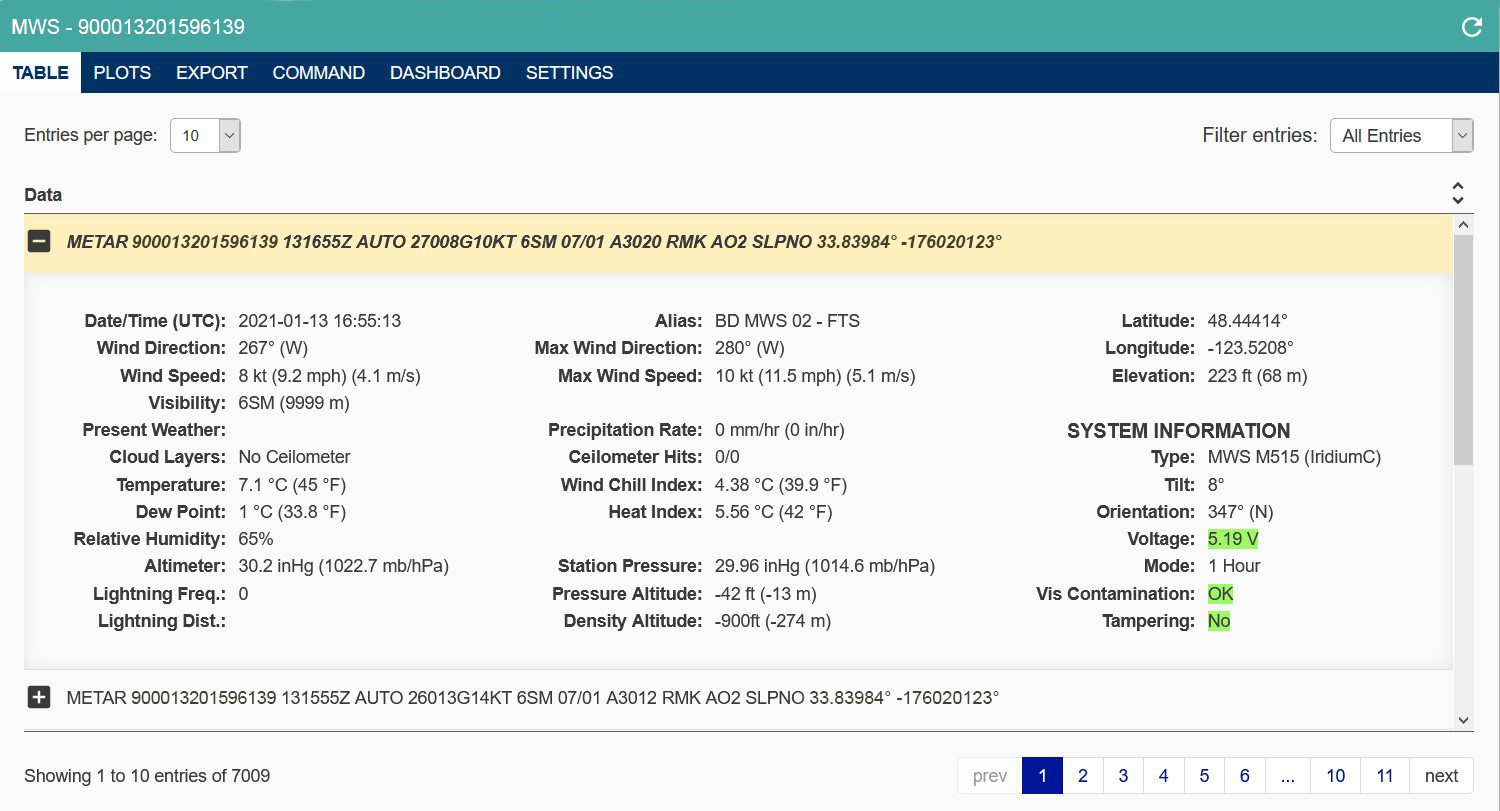
The Data Available in This Window Includes
Environmental Parameters
- Observation timestamp (in UTC)
- Wind Speed and Direction
- Max Wind Speed and Direction
- Visibility
- Temperature
- Dew Point
- Relative Humidity
- Altimeter
- Lightning Frequency and Distance
- Max Wind Direction and Speed
- Precipitation
- Cloud Layer Height(s)
(MWS-C600 and MWS-M625 models only) - Wind Chill Index
- Heat Index
- Station Pressure
Location Information
- Pressure Altitude
- Density Altitude
- Latitude / Longitude
- Elevation
System Information
- Alias
- Tilt
- Orientation
- Battery Voltage
- Reporting Mode
- Visibility Sensor Check
(MWS-C500, MWS-C525, MWS-C625, MWS-M525, and M625 models only) - Tampering Detection*
*Tampering is determined by the following criteria: Latitude has changed by > 0.005, Lon has changed by > 0.005, Elevation has changed by > 3.0, Tilt has changed by > 5.0, or orientation has changed by > 10.0. Compared to the observation 1 hour prior.
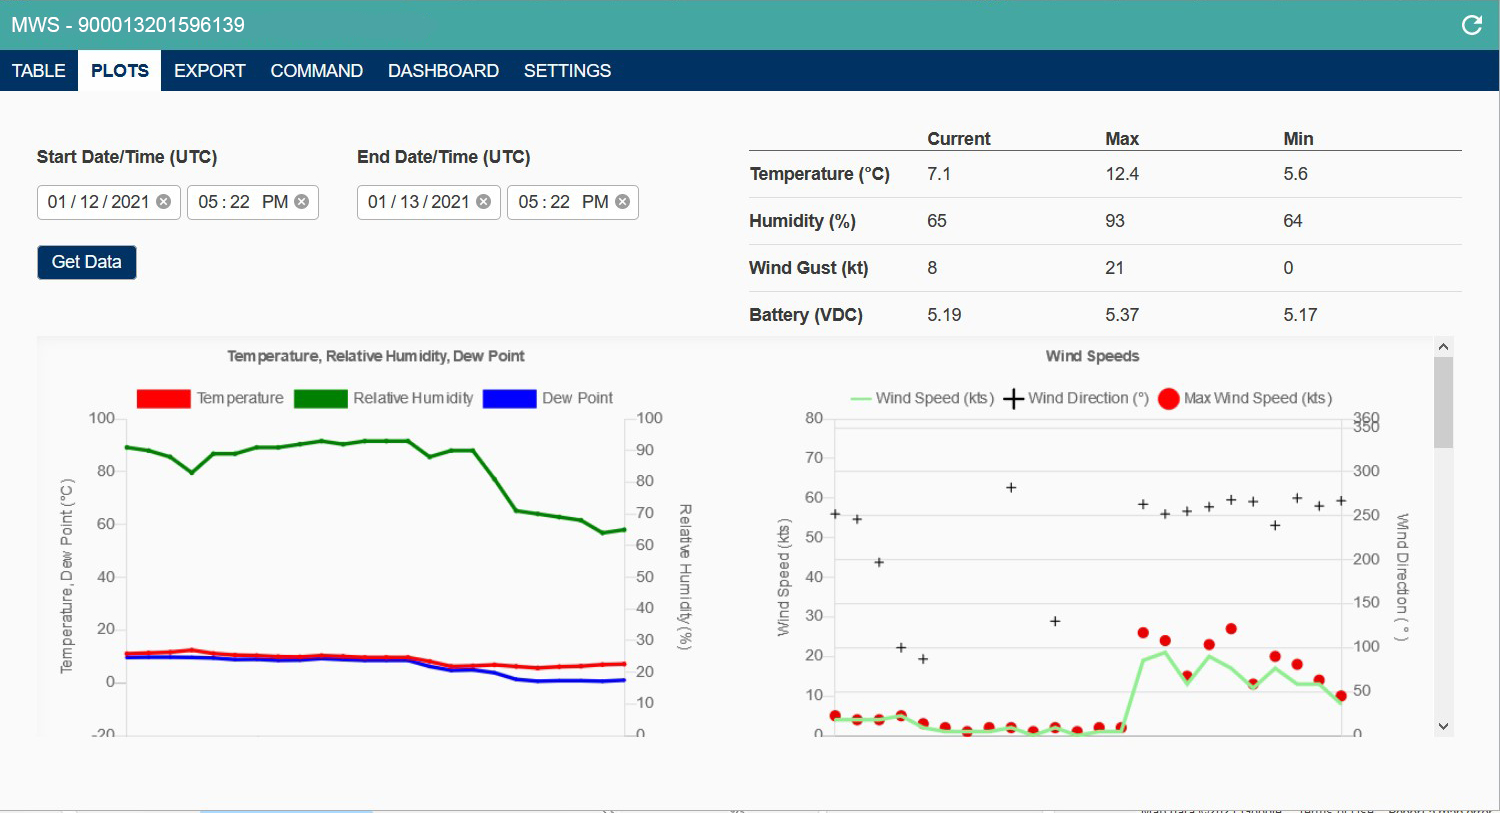
Graphing & Visualization
Quantimet enables users to quickly plot and visualize environmental data. Weather data automatically populates six areas:
- Start Date/Time
- Current/Min/Max Table Values
- Temperature, Relative Humidity, and Dew Point Line Graph
- Wind Speeds Plot Graph
- Altimeter and Station Pressure
- Lightning
Clicking on each graph/table will open a new window so that you can view your data in even greater detail.
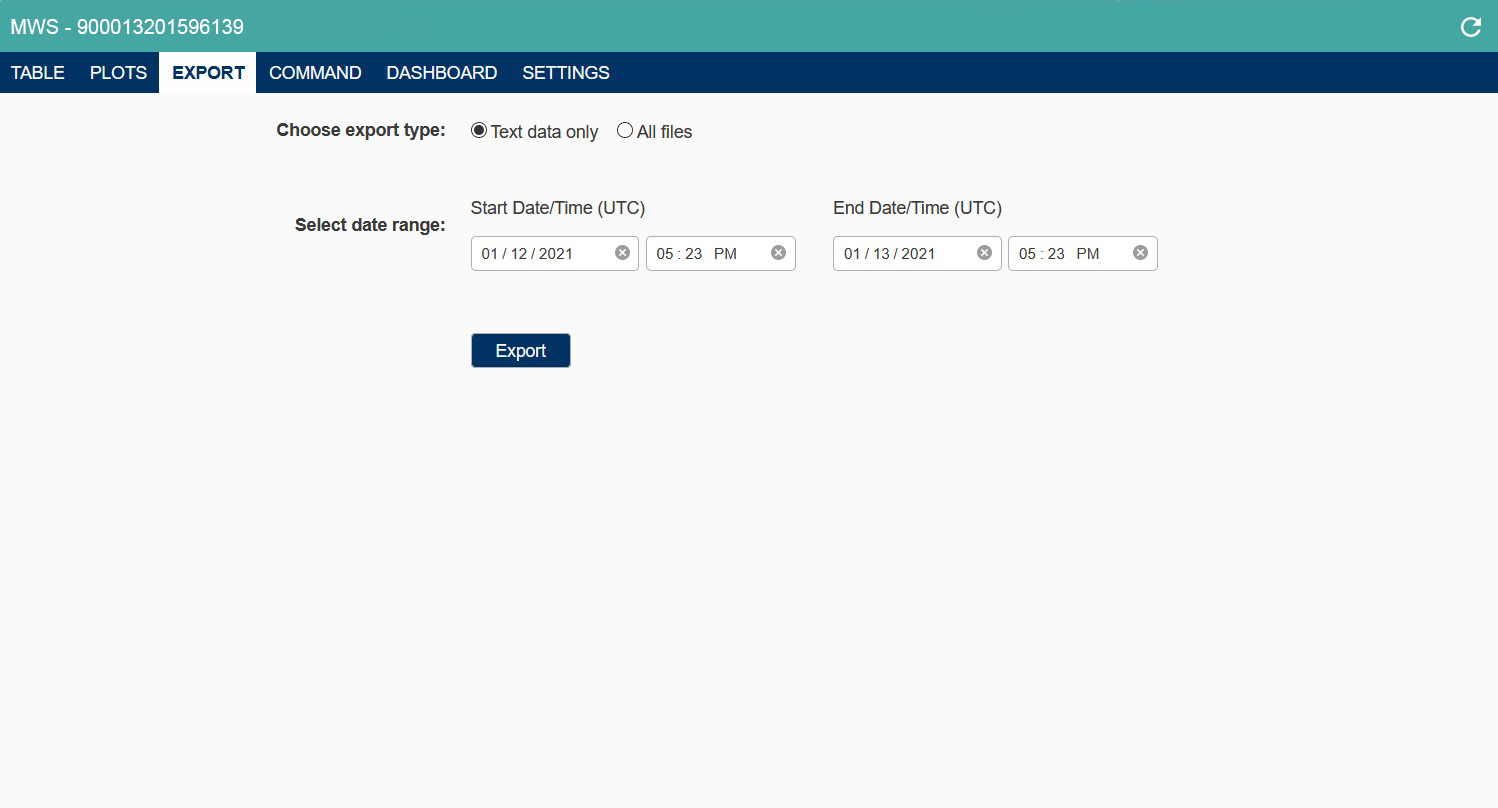
Exporting Data
The Export Tab enables users to view and export data to other software or platforms. Simply choose between exporting all files (including site imagery) or text data only, then select a date range. A prompt will then appear to download your data as a .zip file.
Remote Commands
The Command tab allows you to send remote commands to individual sensors. You can change the reporting frequency, enable GPS reporting, request an image, and receive a ceilometer reading (if applicable).

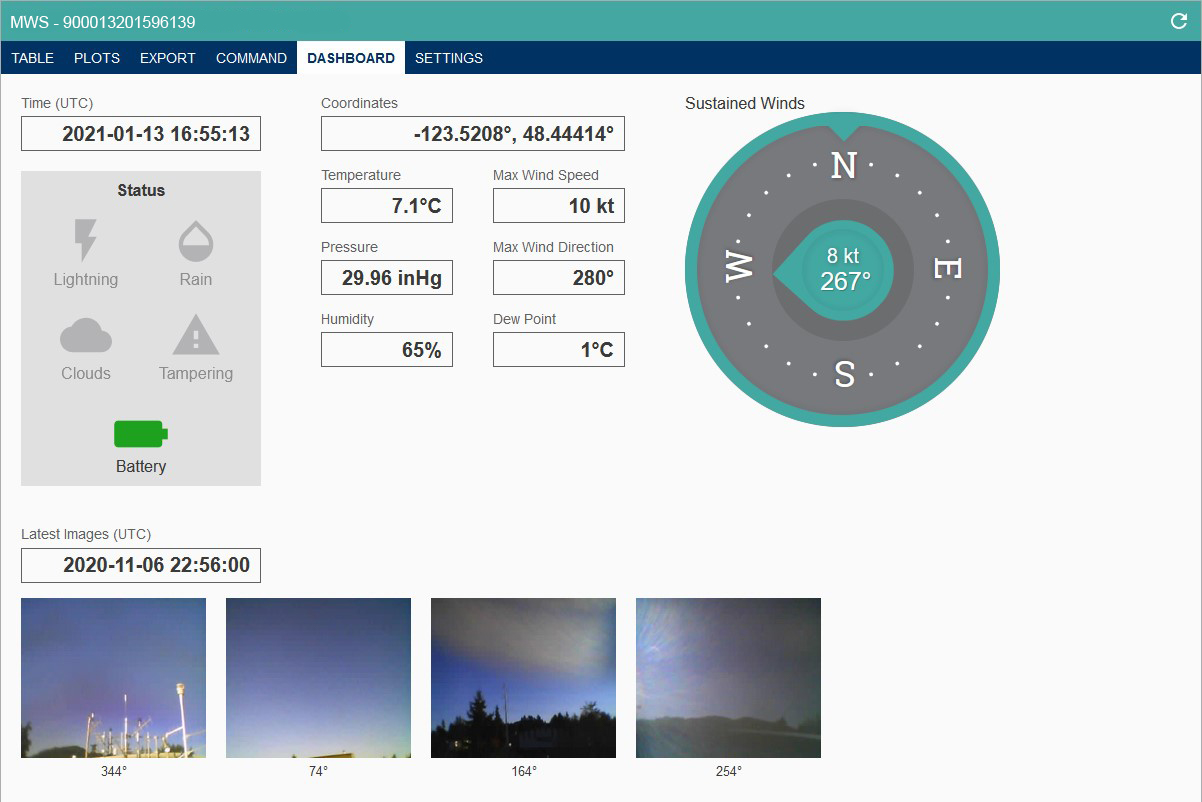
Dashboard View
To receive a complete overview of the present weather conditions, there is the Dashboard view. Clicking on the Dashboard tab in the Data Window will show the present date, the sensor?s coordinates, current status indicators, and present weather parameters. For users of the C5XX or C6XX models, you will also see the latest images reported alongside a time stamp.
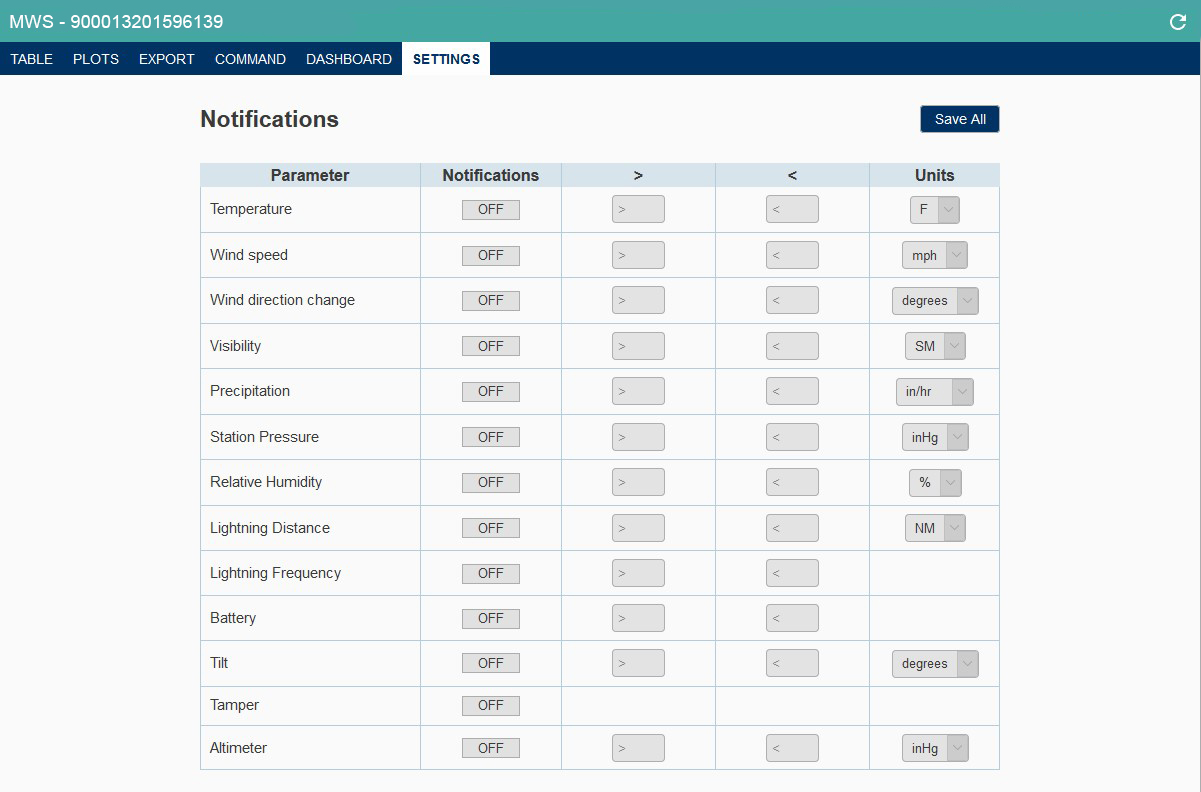
Settings
The Settings tab enables users to receive notifications based specific parameters for individual devices. You can set notifications based on minimum/maximum thresholds of each parameter, as well as toggle between metric and imperial units.
Future Enhancements
- Increased account security
- Backing up data from Production and Retrieving data from archive
- Mobile optimization
- Renew subscription via PayPal